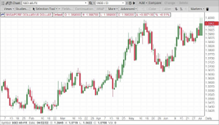
Bitcoin failed to hold prices around $20,000 and reached a low $17,579 on 20th June. This will be the third consecutive month of lower closes seen last year over the same period (April to June 2021) and more recently at the end of last year (November 2021 to January 2022). Weak economic condition expectations have placed downward pressure on all risky markets including the crypto markets.
The Bank for International Settlements (BIS) through the Basel Committee on Banking Supervisions, released in a consultative document (“Second consultation on the prudential treatment of cryptoassets”), a proposal to limit a banks’ total exposure to “Group 2 cryptoassets to 1% of Tier 1 capital”. This potentially would allow banks to hold bitcoin on their balance sheet of up to 1% of capital reserves.
As bitcoin price continued to fall, MicroStrategy purchased approximately 480 bitcoins for $10 million (around $20,817 per coin) between 3rd May and 28th June. This latest purchase brings the company’s holdings to approximately 129,698 bitcoins. Meanwhile, El Salvador’s President Nayib Bukele announced the purchase of $1.52 million worth of bitcoin (80 bitcoins at $19,000 per coin) bringing the country’s total to 2,301 bitcoins.
DAILY TREND: DOWN
Source: ICE Connect
The fall in bitcoin’s price continued for a third month in a row to end the second quarter at levels not seen since December 2020. After bitcoin traded sideways for most of May, it broke through $28,000 on 13th June and reached $22,600 or lower by 22.5% in a single day.
On 20th June, price spiked to a low at $17,579 and remained above that price for the rest of the month.
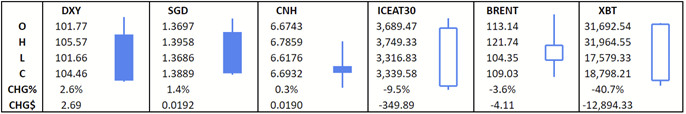
XBT closed the month at $18,789 with a -40.7% change.
UPCOMING HIGH IMPACT EVENTS
Spring 2024 bitcoin halving event
US Dollar -
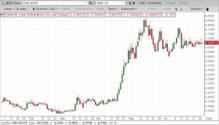
The U.S. Dollar Index ® (USDX) closed the month at 104.46 with a gain of 2.65%, after reaching a high at 105.57 on the 15th June, the strongest the USDX had traded in two decades.
Nonfarm Payrolls data released on 3rd June reported 390,000 new jobs were created during May, this welcomed news exceeded expectations of 325,000. Overall, it resulted in a positive day of trading as the USDX closed at 102.16 with a gain of 0.37%.
Consumer Price Index (CPI) data for all items released on 10th June showed an unexpected jump as inflation data rose to 8.6%, the highest level since December 1981 before seasonal adjustments for the 12-month period ending May, accelerated by the rapid rise in energy and food costs. Prices for all items less food and energy recorded a 6.0% increase over the last 12 months, slowing for a second consecutive month. The USDX closed the day at 104.15 with a gain of 0.82%.
The Federal Reserve announced a 75 basis point interest hike to help curb soaring inflation as it continued to run at a four-decade year high. This aggressive move was the highest increase seen since 1994 and further aggressive rises are likely to be announced at the July meeting. Concerns grow, as this monetary policy tightening will likely have a wider negative impact on the U.S. economy as growing costs continue to bite.
June trading started with a strong first day performance in the U.S. Dollar Index ®. The market surged during the U.S. session as the bulls established control as money flowed into the safe haven currency. This aided the recovery of some of the losses made during the final week of May trading.
Positive ISM Manufacturing PMI data for May released on 1st June saw figures published at 56.1 which came out above expectations of 54.5 and April data released at 55.4. This was welcomed news although year to date manufacturing growth shows a steady downward trend. The demand for the U.S. Dollar continued throughout the day as the bulls drove the U.S. Dollar Index ® higher to close the day with a gain of 0.75% at 102.53 the highest close the U.S. Dollar Index ® had seen over the previous seven trading days.
It was at the high of the day, 102.75 on 1st June the U.S. Dollar Index ® met some resistance as the market reached a pocket of selling pressure at 102.57 - 102.79 (4-hour timeframe), backed up with a daily resistance area just above at 102.81 - 103.30. This caused the U.S. Dollar Index ® to pull back from the high. The decline continued as weakness crept into the U.S. Dollar and the bears established control during the European session. The drop exacerbated further as ADP Employment Change data for May released disappointing numbers with 128,000 new jobs created against April revised figures of 202,000 (previously 247,000) and significantly below expectations of 300,000. This bearish momentum continued throughout the day and the U.S. Dollar Index ® closed 2nd June trading down at 101.83, a loss of 0.75% almost eradicating the prior day’s gains.
The U.S. Dollar Index ® recovered some of the prior day losses on 3rd June aided by positive Nonfarm Payrolls data for May that announced 390,000 new jobs created against expectations of 325,000. In addition, there was an uplift to April’s published figures with 436,000 jobs created against previous recorded figures of 428,000. This was good news as concerns loom around a possible economic slowdown and surging levels of inflation. Other highlights were the unemployment rate remained steady at 3.6%, just above the lowest rate last seen in 1969 and average hourly earnings rose during May albeit slightly lower than expected.
Even the negative news for May ISM Services PMI data released later that day at 55.9 which showed a further decline based on the prior month's release at 57.1 and below expectations of 56.4 did not dampen the bullish direction on the U.S. Dollar. The U.S. Dollar Index ® closed the day up by 0.37% at 102.16.
The first week of June trading the U.S. Dollar Index ® closed 102.16 a gain of 0.48%, the first gain in three weeks.
After a bearish start to trading on 6th June, the U.S. Dollar found support near Friday's low. The U.S. Dollar Index ® rose as risk appetite faltered and the U.S. Dollar bulls returned lured by the appeal of the safe haven nature of the U.S. Dollar. The U.S. Dollar Index ® rallied throughout trading with the bulls firmly in control to close the day out bullish at 102.45 with a gain of 0.21%.
Tuesday 7th June trading, the U.S. Dollar Index ® continued the positive momentum seen during the prior day as the bulls drove the market higher. The U.S. Dollar Index ® reached the daily resistance area at 102.81 - 103.30 which it just fell short of earlier in the month where sellers were waiting. With the bears in control the U.S. Dollar Index ® declined from the high of 102.85, which also coincided with Treasury Secretary Janet Yellen’s speech to the Senate Finance Committee. The speech focused on inflation being elevated and highlighted the need to utilise the appropriate budgetary stance whilst complementing the actions that the Federal Reserve are taking to help curb inflation through monetary policy. A balancing act will be needed in order not to undermine the economy. The U.S. Dollar Index ® closed the day down at 102.32 with a loss of 0.15%.
Fortunes reversed during early trading on 8th June as the U.S. Dollar found some strength and recovered some of the losses made after the previous day's drop. The bulls drove the market higher and the U.S. Dollar Index ® just fell short of the daily resistance area at 102.81 - 103.30 that dominated the market direction the prior day as selling pressure came in. The U.S. Dollar Index ® dropped from a high of 102.78 as the bears regained control throughout early trading in the US session. The bearish move faltered when the market reached a small pocket of support formed on a low timeframe with a range of 102.33 - 102.26 incorporating the low of the day on 7th June, here buyers were waiting and the U.S. Dollar Index ® took a bounce. The market rallied to close the day up at 102.55, a gain of 0.14%.
On 9th June the U.S. Dollar Index ® struggled to reach the prior day high during early trading and the market dropped to retest the prior day low and in doing so revisited the pocket of support created on 7th June 102.33 – 102.26 which eventually broke on a further retest. The U.S. Dollar Index ® found some support lower down which propelled the market upwards, the strong move aided by the selloff in U.S. stocks, which sent investors into the U.S. Dollar as a safe haven. The U.S. Dollar Index ® rallied throughout the remainder of the day to challenge the previously tested daily resistance area at 102.77 - 103.27 piercing through the upper boundary of the Bollinger Bands on a 4-hour chart, breaking through the daily 20 SMA before pulling back slightly to close the day with a gain of 0.61% at 103.22.
On 10th June the strong bullish momentum continued throughout the trading day. Positive news was announced in relation to Core inflation figures (all-items less food and energy) which published an increase of 6.0% (12-month ending May) showing a slowdown compared to 12-month ending April data at 6.2% and March at 6.5% which was welcomed news. This however was against the backdrop of the Consumer Price Index data for all items which unexpectedly rose to 8.6% for 12-month ending May, the highest rate since December 1981 and above market expectations of 8.3%. This increase was driven by energy prices that rose by 34.6% and food costs leapt up 10.1%, the largest increase since March 1981.
As inflation remains one of the key priorities, to help gauge future inflation expectations ICE Benchmark Administration has launched the ICE U.S. Dollar Information Expectation Index Family. A useful tool to help answer some of the key questions that will affect how the monetary policy will unfold within the coming quarters
Michigan Consumer Sentiment data released on 10th June had little impact on the U.S. Dollar Index ® once the bulls took control and even the negative data released 50.0 (revised down from the initial release of 50.2) against expectations of 58.0 and the prior release at 58.4 did not entice the bears back. The U.S. Dollar Index ® closed the day 104.15, a gain of 0.82%.
The second week of June trading the U.S. Dollar Index ® closed with a gain of 1.88% at 104.15.
The bullish momentum continued into the third week of trading on the U.S. Dollar Index ®. Monday 13thJune had a strong performance with the bulls firmly in control. The high demand for the U.S. Dollar saw the U.S. Dollar Index ® blast through the resistance areas on the lower timeframes. The move was so strong the market sliced through a higher daily area of resistance which was untested at 104.50 – 105.07 to consume any residual sell orders in its path to break through the upper boundary of the daily Bollinger Bands before pulling back slightly from a high of 105.15. The U.S. Dollar Index ® closed the day at 104.97 with a gain of 0.83%, the largest one-day gain in June.
The U.S. Dollar bulls drove the market higher on 14th June and with this momentum, the U.S. Dollar Index ® found itself higher within a monthly area of resistance with a wider range of 104.12 – 109.75. The wider area is formed with multiple resistance areas nested within from the weekly and daily timeframes. The first daily resistance area with a range of 104.50 – 105.07 was reached on 13th June which created a slight pull back towards the end of the trading day although the bears returned with more vigor on 14th June during the Asian trading session and the market dropped. The U.S. Dollar Index ® took a brief pause as it reached a small pocket of support on a 2-hour chart to create the low of the day before rallying to break through the upper boundary of this resistance area, the highest the U.S. Dollar Index ® had traded since December 2002. The U.S. Dollar Index ® closed the day at 105.34 remaining above the upper boundary of the daily Bollinger Bands with a gain of 0.32%.
On 15th June the U.S. Dollar bears returned during the Asian session and the market dropped although it failed to break the small pocket of support previously tested and the U.S. Dollar Index ® rallied. Retail Sales data published poor reading for the U.S. economy with May month on month data recording a drop in sales into negative territory at -0.3% against an expected rise of 0.2% and April published data at 0.7% (downwardly revised from 0.9%). Undeterred by this news the U.S. Dollar Index ® broke through the upper boundary to reach a high of 105.57 where sellers drove the market lower.
The Federal Open Market Committee met on 15th June to review overall economic activity as concerns around inflation remain even with the U.S. announcing strong jobs data in real terms wages are shrinking. Janet Yellen’s testament to the Senate Finance Committee earlier this month confirmed the Fed is pursuing the need to bring inflation inline using the appropriate monetary policy which was reiterated by Fed chair Jerome Powell as inflation remains one of the Fed's top priorities and has caused a surprise to the upside over the past year.
The Fed announced an increase in interest rates by 75 basis points, a surprise leap compared to the expected hike of 50 basis points. This aggressive move demonstrated the willingness to tackle inflation head on to bring it down from the 40-year highs whilst avoiding causing a recession; this was the largest increase in interest rates since 1994. The Fed also did not rule out that similar rate hikes could be announced at the July meeting.
The U.S. Dollar Index ® reached a high of 105.57 creating a fresh two-decade high before closing the day at 104.93 a loss of 0.19%.
As inflation is set to play a key role in interest rate decisions throughout 2022, the ICE U.S. Dollar Information Expectation Index Family is a great tool to help plan for the future. The chart below provides the historical Index setting over the past year:
Further information can be found on the ICE U.S. Dollar Inflation Expectations Index Family: https://www.ice.com/iba/usd-inflation-indexes
On 16th June, the selling pressure mounted as the bears continued to show their dominance in the market after the U.S. Dollar Index ® met resistance at the high during the prior trading day. The market reached a high in the European session at 105.28, tested the upper band of the daily Bollinger Bands and dropped, the bearish momentum continued throughout most of the day until the market reached a small pocket of support where buyers waited at 103.24 - 103.06 on a 4-hour chart the market took a small bounce upward. The U.S. Dollar Index ® closed down at 103.42, a loss of 1.13%, the largest one-day drop recorded for June.
Trading on 17th June was largely positive with the bulls regaining control. Fed Chair Powell testified before Congress and reiterated the Feds position to bring down the soaring inflation rate in line with the longer-term 2% policy objective. Powell stated that rates would continue to be raised in order to help meet the target. The U.S. Dollar Index ® closed an inside day at 104.49 with a gain of 0.77%.
The U.S. Dollar Index ® closed the week at 104.49 with a gain of 0.37% for a third consecutive weekly positive close.
Trading on 20th June was lackluster as the U.S. Dollar Index ® failed to reach the high or low of the prior day and closed within a tight trading range, slightly down for the day at 104.49, a loss of 0.01%. The 20th June was a federal holiday ‘Juneteenth’ where banks and markets were closed.
21st June another low volatility day with the U.S. Dollar Index ® closing 104.21, a loss of 0.03%. This continued to be the theme throughout the remainder of the week as the U.S. Dollar Index ® moved sideways, edging down slowly to close down on 22nd June at 103.98 with a loss of 0.22%.
23rd June was the only positive trading day for the week when the U.S. Dollar Index ® closed up by 0.18% at 104.19.
The final day of the week ended with the U.S. Dollar Index ® at 103.96 with a loss of 0.19%. Whilst the agenda was busy throughout the week with speeches from the Fed Chair Jerome Powell, appetite for the U.S. Dollar waned as money moved away from the safe-haven currency. Jerome Powell’s speeches did not give anything away that was not already factored into the market.
The U.S. Dollar Index ® closed the week at 103.96 with a loss 0.52%.
Trading on 27th June the U.S. Dollar Index ® was mixed and although the bulls tried to drive the market higher in early trading the bears regained control and the market dropped. Above estimated Durable Goods Orders for May, came out at 0.7% against expectations at 0.1% although this did not help to entice the bulls back. It was not until the U.S. Dollar Index ® tested the mid-point of the daily Bollinger Bands where support was evident. It was at the daily 20 SMA when the bulls returned sending the market higher to recover some of the losses made earlier in the day. The U.S. Dollar Index ® closed at 103.68, down 0.18%.
On 28th June, the mid-point of the daily Bollinger Bands provided some support as the U.S. Dollar Index ® bears tried to push the market lower. After rejecting lower prices the U.S. Dollar Index ® rebounded with the bulls sending the market higher to close the day with a strong performance at 104.26, a gain of 0.54%.
This bullish momentum continued throughout the majority of trading during the 29th June as the U.S. Dollar Index ® continued to rally. Gross Domestic Product data published showed Annualized GDP for Quarter 1 was in negative territory at -1.6%, although this was disappointing news indicating a contraction, this was not far off the preliminary indication for Quarter 1 announced in May therefore resulted in little market reaction. The U.S. Dollar Index ® continued its upward move to close up for the day at 104.85 with a gain of 0.56%.
Early trading on 30th June saw the U.S. Dollar bulls drive the market higher encouraged by safe-haven flows, although as price approached 15th June highs resistance was evident and the bears stepped in sending the U.S. Dollar Index ® lower for the remainder of the day. The U.S. Dollar Index ® closed at 104.46 with a loss of 0.35%.
The uptrend in the U.S. Dollar Index ® on the daily timeframe has resumed as the trend continues to remain up on the weekly timeframe. The U.S. Dollar Index ® closed the month of June at 104.46 with a gain of 2.65%.
UPCOMING HIGH IMPACT EVENTS
Fri 1 Jul ISM Manufacturing PMI (Jun)
Wed 6 Jul ISM Services PMI (Jun)
Wed 6 Jul FOMC Minutes
Thr 7 Jul ADP Employment Change (Jun)
Fri 8 Jul Nonfarm Payrolls (Jun)
Wed 13 Jul CPI (Jun)
Fri 15 Jul Retail Sales (Jun)
Fri 15 Jul Michigan Consumer Sentiment (Jul) PREL
Wed 27 Jul Durable Goods Order (Jun)
Wed 27 Jul Nondefense Capital Goods Orders ex. Aircraft (Jun)
The South Korean Won closed June at 1287.51 KRW against the U.S. Dollar after trading to a high of 1307.80, the weakest the South Korean Won had traded against the U.S. Dollar since July 2009.
S&P Global Manufacturing PMI data for May was released on 2nd June with disappointing results recording 51.8 against expectations of 51.9 and a drop on the prior month data released at 52.1.
Consumer Price Index (CPI) for all items 12-month ending May released on 2nd June showed inflation continued to rise with an increase of 5.4%, above expectations of 5.1% and 12-month ending April at 4.8%. All items less food and energy also showed an increase with data 12-month ending May at 3.4% as inflation continues to post higher numbers.
Industrial Production data published on 29th June for 12-month ending May recorded a surprise increase of 7.3% against 3.1% which was expected. This showed a turnaround after disappointing numbers were released 12-month ending April at 3.5% (revised upward from 3.3%) and above March data of 3.7%.
DAILY TREND: SIDEWAYS/UP
Source: ICE Connect
During the first day of June trading the U.S. Dollar bulls drove the pair higher throughout the day as positive data was released in the U.S. The USDKRW closed the day up at 1246.75 with a gain of 0.35%.
The momentum to the upside continued into early trading on 2nd June until the USDKRW reached a small pocket of resistance on a 4-hour chart at 1252.25 – 1257.05 where sellers were waiting. The bears took control and the pair dropped heavily throughout the day to close with a loss of 0.48% at 1240.32. The U.S. Dollar losses were a significant gain for the South Korean Won as this is the quote currency in the pair.
On 3rd June, the bulls returned and the demand for the U.S. Dollar was strong. The USDKRW rallied to recover most of the losses made from the prior day to close at 1250.58, just short of the prior day high with a gain of 0.83%.
The USDKRW closed the first week of June at 1250.58 with a slight loss of 0.04%.
The bullish momentum from Friday continued into the new trading week as the demand for the U.S. Dollar remained high. The USDKRW retested the small pocket of resistance at 1252.25 – 1257.05, this time there was little in the way of resistance and the pair rallied higher. The USDKRW closed 6th June with a gain of 0.24% at 1253.63.
The bullish momentum continued into the following trading day with nothing to stop it on the daily chart. The pair broke through the pocket of resistance in the 4-hour timeframe but faltered as the USDKRW approached the upper Bollinger Band (+2.0 SD) on the 4-hour chart, which was in a similar vicinity to the mid-point on the daily chart. The upper band on the 4-hour acted as resistance on each test throughout early June trading. Selling pressure returned as the pair reached a high of 1259.94. The USDKRW closed at 1254.35 with a modest gain of 0.06%.
The bears were in control throughout the majority of trading on 8th June until the USDKRW took a bounce from the mid-point of 4-hour Bollinger Bands. Again, nothing to stop it on the daily chart the bounce was constrained by the upper Bollinger Band on the 4-hour. The USDKRW closed with a gain of 0.19% at 1256.69.
On 9th June, the demand for the U.S. Dollar gathered momentum and the bulls drove the pair higher to blast through the 20 SMA on the daily chart. The USDKRW closed the day with a gain of 0.51% at 1263.81.
This bullish momentum picked up pace on the 10th June and the USDKRW closed with the largest one-day gain for June to date at 1.22% for the day at 1279.32. This was the largest one-day loss for the South Korean Won being the quote currency.
The USDKRW closed the week at 1279.32 with a gain of 2.30% for the week. The largest weekly gain since March 2020. A significant loss for the South Korean Won.
The bullish momentum continued in Monday trading and the USDKRW printed another strong gain for the day. The pair closed at 1290.36, a gain of 0.86%, the seventh consecutive higher close breaking and closing above the upper boundary of the daily Bollinger Bands.
During 14th June trading the bears pushed back and the USDKRW closed down for the day at 1288.10, a loss of 0.27% putting an end to the positive run of daily closes.
This bearish momentum continued into the following trading day and the USDKRW closed at 1278.12 after just spiking through a small pocket of support on a 4–hour chart at 1282.63 – 1277.38.
This support area held and the USDKRW closed higher for the following two trading days as the bulls stood their ground.
The USDKRW closed the week at 1291.26 with a gain of 1.02%.
Early trading during the week of 20th– 24th, June was very lackluster from a daily perspective. The pair traded sideways as the bulls and the bears struggled to gain overall control of direction. The USDKRW printed a small loss of 0.04% at the close on 20th and almost no change on 21st June.
22nd June was a more volatile day as the pair finally broke out above the prior day’s highs and ventured into territory that the USDKRW had not seen since July 2009. It was at the high of the day, 1305.14 the selling pressure returned and the pair dropped to close at 1296.71 with a gain of 0.46%.
The bulls drove the pair higher on 23rd June and the USDKRW made a high of 1307.80 before it retreated. The weakest the South Korean Won had traded against the U.S. Dollar in almost thirteen years worrying news for this export led economy. The USDKRW closed at 1299.18, a gain of 0.19%.
The bearish momentum gathered pace on 24th June and as the USDKRW dropped to close with a loss of 0.79% at 1288.88.
Overall, the week ended with a loss of 0.18%.
The bearish tone continued into 27th June trading and the USDKRW closed with a loss of 0.30% at 1285.07.
Fortunes reversed on 28th and 29th June as the bulls’ regained control to drive the pair higher. The USDKRW closed positive for two consecutive trading days at 1291.48, with a gain of 0.50% and at 1301.90 with a gain of 0.85% respectively.
On the final trading day in June, the bears returned and USDKRW closed at 1287.51, a loss of 1.11%.
The weekly uptrend continued even with the significant pull back observed in May. However, the USDKRW trend direction is sideways on the daily chart as we had seen higher highs and lower lows, although the pair had re-established its position trading above the 20 SMA in the upper boundary of the daily Bollinger Bands.
The USDKRW closed the month at 1287.51 with a gain of 3.63%. The second largest monthly loss for the South Korean Won against the U.S. Dollar this year.
UPCOMING HIGH IMPACT EVENTS
No major events listed
Singapore Dollar -
The Singapore Dollar closed the month weaker at $1.3889 against the U.S Dollar after losing 1.40% of its value during June trading eradicating the gains the Singapore Dollar had made during May.
Positive PMI Manufacturing data was released on 2nd June as May showed a slight increase in expansion with 50.4 against 50.3 reported in April whilst this fell short of expectations of 50.7 it still printed the twenty third month of expansion in manufacturing activity.
Consumer Price Index (CPI) data released on 23rd June showed a continued increase with CPI - all items 12-month ending May at 5.6%, this was above 12-month ending April and March which had levelled off at 5.4%. This release was the highest increase since November 2011 and above market expectations of 5.5%. Increased energy costs was the main driver behind pushing costs such as food and clothing higher.
Industrial Production data released on 24th June showed a significant uplift with manufacturing output for 12-month ending May released at 13.8%, a substantial increase compared to 12-month ending April at 6.4% (revised up from 6.2%) and March at 5.1% (revised from 3.4%) and beating market expectations of 5.8% rise. Month on month data did not disappoint with a surge to 10.9% in May, a welcomed position after April recorded 2.1% (revised down from 2.2%) and March month on month data, which was in negative territory at -11.2%.
DAILY TREND: SIDEWAYS/UP
Source: ICE Connect
Positive data in the U.S. led the U.S. Dollar bulls to push the USDSGD higher on the first trading day of June to close up for the day at 1.3740, 0.31%. The momentum to the upside caused the Singapore Dollar to lose value being the quote.
On 2nd June U.S. Dollar bulls drove the pair higher during early trading, even positive PMI data from Singapore did not pose a threat. In the European session the USDSGD reached a small pocket of resistance at 1.3754 - 1.3779 (found on the 4-hour chart) where the bears were waiting and fortunes reversed. Money moved away from the U.S. Dollar to the benefit of the Singapore Dollar. The USDSGD closed the day at 1.3699, down 0.34%.
Trading on 3rd June the bulls returned and the USDSGD rallied, positive Singapore Retail Sales data was not enough to encourage flows into the Singapore Dollar. The pair rallied throughout the day, much of this was due to positive data in the U.S with the release of Nonfarm Payrolls. The USDSGD tested the resistance area reached on the prior day and pulled back slightly to close at 1.3757 with a gain of 0.40.
The first week of trading the USDSGD closed at 1.3757, a gain of 0.39%.
Trading on 6th June USDSGD dropped during early trading however, the U.S. Dollar bulls returned and the day closed with a gain of 0.10% at 1.3759.
This bullish momentum continued into early trading on 7th June as the pair blasted through the small pocket of resistance that had held throughout early June trading. The USDSGD rallied until it reached another pocket of resistance refined on a daily timeframe with a range of 1.3799 – 1.3833 where it met intense selling pressure as the bears returned. The pair closed at the low with a loss of 0.23% at 1.3731. A piece of respite for the Singapore Dollar as it benefited from this drop.
The bulls returned on 8th June and the pair rallied to close the day with a gain of 0.19% at 1.3757.
On 9th June trading the bulls drove the pair higher and the USDSGD convincingly broke above the mid-point of the daily Bollinger Bands after trading in the lower range since 19th May. The pair closed at 1.3816 with a gain of 0.43%.
The bullish move continued into trading on 10th June as demand for the U.S. Dollar remained high. The USDSGD eventually broke through the daily resistance area to close up 0.38% at 1.3876, for a third consecutive gain.
The USDSGD closed the week at 1.3876 with a gain of 0.95% for the week.
The bullish momentum continued on 13th June as the USDSGD posted a fourth consecutive higher close at 1.3946 with a gain of 0.57%.
On the 14th June, after the previous four-day 1.57% rally the USDSGD was high into a weekly resistance area at 1.3872 – 1.3993 and had traded beyond the upper boundary daily Bollinger Bands. The pair met some resistance and pulled back slightly from the high of 1.3958 to close at 1.3935 with a small loss on 14th June of 0.05%.
The bearish momentum picked up during the following trading day and the USDSGD closed down with a loss of 0.53% at 1.3862.
The bulls fought back during trading on 16th June although ultimately the bears regained control and the USDSGD closed at 1.3829 down 0.21% for a third straight day of losses, giving the Singapore Dollar the chance to make up ground.
On 16th June, the USDSGD reached a breakout area created as price broke above the previous resistance. Buyers stepped in on 17th June and the pair rallied. The USDSGD closed at 1.3901 with a gain of 0.52%.
The week ended with the USDSGD up by 0.24% at 1.3901 for a third week of higher closes.
The following week 20th– 24th June the USDSGD was range bound as the pair failed to close above the high formed on 17th June at 1.3911 and failed to close below the low 1.3829.
On the final trading day of the week, 24th June, positive Industrial Production data released in Singapore made a small difference in the Asian session as money moved into the Singapore Dollar however; the most likely culprit for the overall drop throughout the day for the USDSGD was the lack of appetite for the safe haven U.S. Dollar. The USDSGD dropped 0.32% to close at 1.3855.
The USDSGD closed the week with a loss of 0.19% at 1.3855.
The final week of June trading opened and the bears drove the USDSGD lower during early trading. The bulls returned as price reached the mid-point of the daily Bollinger Bands during the U.S. session and the demand for the U.S. Dollar increased to propel the USDSGD upwards. After reaching a low of 1.3838, the USDSGD closed at 1.3855, a loss of 0.11%.
On 28th June, the USDSGD dropped during early trading and again the mid-point of the daily Bollinger Band provided vital support as the buyers stepped in and drove the pair higher to close the day positive at 1.3873 with a gain of 0.13%.
The bullish momentum continued throughout trading on the 29th June and the USDSGD closed up 1.3932, a gain of 0.43%.
The final day of trading the bears returned and the Singapore Dollar recovered some lost ground from the prior day as the pair closed down at 1.3889 a loss of 0.24% for the day.
On a daily chart, we are in a sideways phase as we await clear direction. The weekly uptrend remained. The USDSGD closed the month with a gain of 1.40% at 1.3889.
UPCOMING HIGH IMPACT EVENTS
No major events listed
Chinese Yuan -
The Chinese Yuan Renminbi closed June at 6.6932 CNY against the U.S. Dollar after losing 0.28% of its value during June trading.
Consumer Price Index (CPI) data released on 10th June levelled off with inflation12-month ending May at rate of 2.1% equal to 12-month ending April, the highest seen since November 2021 although slightly below expectations of 2.2%. Much of the rise was driven by food consumption as China began easing some of the COVID restrictions placed on some of the major cities.
Industrial Output data published on 15th June for 12-month ending May by the National Bureau of Statistics of China was released at 0.7%, a welcomed increase after the significant fall in production recorded for 12-month ending April at -2.9% which was mainly due to the COVID restrictions which were in place at the time. This also exceeded expectations, which was in negative territory at -0.7%.
The NBS Manufacturing PMI data released on 30th June recorded a further improvement as figures released for June came out at 50.2, whilst this fell short of expectations at 50.5 it exceeded May data at 49.6. Non-Manufacturing PMI data for June showed a significant improvement on the prior months data as figures released 54.7 against 47.8 for May, the first expansion seen in four-months and above expectations of 52.5.
DAILY TREND: SIDEWAYS
Source: ICE Connect
The USDCNH had a positive start to June after the U.S. Dollar bulls drove the pair higher during the Asian session. The upward momentum failed to break the mid-point of the daily Bollinger Bands that the pair had been trading around for the previous few days as it had reached a small pocket of resistance on a 4-hour timeframe at 6.7101 - 6.7262. The sellers were waiting and the pair dropped. The bulls returned during the U.S. session and the USDCNH closed the first day of trading with a gain of 0.27% at 6.6926.
The pair retested this pocket of resistance during trading on 2nd June and the bears returned. Subsequently the USDCNH dropped for the following two consecutive trading days to record a loss of 0.99% over this period wiping out recent gains to reach a low on 3rd June at 6.6176.
Here the USDCNH found some support as the pair dropped toward the lower boundary of the daily Bollinger Bands which coincided with a daily area of support at 6.6439 – 6.6119 and fortunes reversed. U.S. Dollar bulls returned and the pair lifted. Trading closed on 3rd June at 6.6275 with a loss of 0.38%.
The USDCNH closed the first week of trading with a loss of 1.33% at 6.6275, bringing strength to Yuan, as this is the quote currency.
The battle between the bulls and bears was evident throughout trading on 6th June as the pair lifted from this daily support area to close marginally up at 6.6528, a modest gain of 0.01%.
The bulls and bears continued to jostle to gain control throughout trading on 7th June as the U.S. session reversed earlier gains made by the U.S. Dollar bulls. The USDCNH closed up 0.20% at 6.6655.
The bulls stood their ground and this bullish momentum continued to gain pace during the day. The USDCNH closed higher for a third consecutive trading day at 6.6978 a gain of 0.48%.
On 9th June during the Asian session, the USDCNH approached the mid-point of the daily Bollinger Bands that it had traded below throughout early June. This triggered a U.S. Dollar sell off giving strength to Yuan. The U.S. Dollar bulls returned later to recover earlier losses and the USDCNH closed marginally higher at 6.6995.
Trading on the 10th June had the bulls firmly in control as the USDCNH blasted through the resistance area on the 4-hour timeframe at 6.7101 - 6.7262 and the mid-point of the Bollinger Bands to close at 6.7270 a again of 0.40%
The USDCNH closed the week at 6.7270, with a gain of 1.12%, resulting in the weakening of the Yuan against the U.S. Dollar.
On Monday 13th June, the bullish momentum continued as the USDCNH closed with a gain of 0.74% at 6.7789 after piercing the upper boundary of the daily Bollinger Bands. This was the largest daily gain for June signifying the largest losing day for the Yuan against the U.S. Dollar.
After piercing the upper boundary of the daily Bollinger Bands on 13th, the USDCNH revisited the high on the 14th June as the demand for the U.S. Dollar drove the pair higher to reach a high of 6.7859 where sellers were waiting.
The bears took control of the market from there and the pair dropped to close at 6.7536 with a loss of 0.33%.
The bearish momentum took hold on 15th June and the USDCNH closed down at 6.6698 posting the largest daily loss for the month at 1.24%, conversely the biggest one-day gain for the Yuan.
The 16th and 17th June printed two positive closes for the USDCNH gaining 0.24% and 0.32% respectively. Overall, the two positive closes which signified U.S. Dollar strength could not recover all of the gains the Yuan had made earlier in the week.
The USDCNH closed the week with a loss of 0.35% at 6.7061.
20th June trading the bears regained control and the USDCNH closed with a loss of 0.38% for the day at 6.6852.
Trading was mixed on 21st June with both the bulls and bears struggling for overall control, the pair closed after an inside day at 6.6871, a modest gain of 0.01%.
22nd June the bulls were firmly in control throughout the Asian session. The bears returned during the European session due to lack of demand for the U.S. Dollar and whilst the pair dropped, the USDCNH did not reach the opening value. Little recovery was made during the U.S. session and the USDCNH closed up for the day at 6.7073 with a gain of 0.24%.
The bears returned on the 23rd and 24th June and the pair continued to drop. The USDCNH posted two consecutive losing days down 0.16% and 0.24% respectively. Overall as the pair dropped the Yuan gained strength (being the quote), gaining 0.40% of its value during this period.
Friday closed at 6.6803, ending the week with a 0.45% loss.
Monday 27th June the bulls found some momentum in the day to recapture some lost ground with the pair closing up 0.10% at 6.6861.
On 28th June after the lack of appetite for the U.S. Dollar during the Asian session, things turned around in the European session as the demand for the U.S. Dollar increased and even though some weakness was evident during the U.S. session the pair closed at 6.7006, up 0.21%.
On 29th June, USDCNH struggled to gain much momentum in either direction and closed the day with no change at 6.7017.
The final day of trading the bears regained control and drove the pair lower to close down 0.14% at 6.6932.
USDCNH continues to trade sideways within the daily timeframe although the pair remains in an uptrend on a weekly chart. The USDCNH closed the month of June at 6.6932, with a gain of 0.28%.
UPCOMING HIGH IMPACT EVENTS
Sat 9 Jul CPI (Jun)
Fri 15 Jul Retail Sales (Jun)
Mon 18 Jul GDP (Q2)
Wed 20 Jul PBOC Interest Rate Decision
Sat 31 Jul NBS–Manufacturing & Non–Manufacturing PMI (Jul)
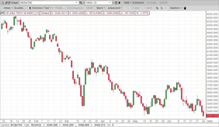
Asia Tech -
After price traded towards $3,750 at the end of May, the ICE Asia Tech 30 Index (ATI) made its way back to the lows in June, trading to a new low at 3,273.64. Many equity indices including the Nasdaq Composite followed this same path during the month.
June was improved for Chinese component stocks, notably Alibaba Group Holding which gained 18.3%, JD.com rose 12.8%, and Kuaishou Technology up by 12.8%. However, NetEase inc. suffered a 11.8% drop and Tencent was slightly lower by 1.7%.
Taiwan stocks components were altogether weaker with MediaTek Inc. falling the most by 28.1%, followed by United Microelectronics Corp. lower by 23.5%, and Taiwan Semiconductor Manufacturing down 13.3%.
Japanese index component Tokyo Electron dropped 27.7%, followed by Murata Manufacturing down 13.4% and close behind is Fujitsu down this month by 12.7%. Only Fujifilm Holdings rose by 3.8%.
Korean component stocks all fell in June with Kakao shedding a further 16.5%, and Naver Corp dropping 17.2%. Samsung Electronic and Samsung SDI dropped 14.5% and 6.5% respectively. SK Hynix suffered a 15.0% drop.
DAILY TREND: DOWN
Source: ICE Connect
ATI created a new low at $3,274 in June which was 10 points lower than the low set in May. Price recovered in the late half of May to reach $3,700 which saw follow through in early June to $3,750, but failed to gain any momentum towards $4,000.
Instead ATI traded back towards the May low in consecutive down days giving one to three trading days of reprieve in the final week of the month.
Technology stocks continue to remain weak along with the broader equity markets.
ATI closed the month at $3,340 with a -9.5% change.
Index Composition: 37% China, 23% Japan, 23% Taiwan and 17% South Korea
UPCOMING HIGH IMPACT EVENTS
Sat 9 Jul China CPI (Jun)
Fri 15 Jul Retail Sales (Jun)
Wed 20 Jul PBOC Interest Rate Decision
Sun 31 Jul China Non-Manufacturing PMI (Jul)
Oil -
Brent crude oil managed to trade above $110 in June and reached the $120-122 area before it settled to close the month at $109.03, 3.6% lower versus May.
The OPEC+ meeting on Thursday 30th June announced production to be increased by 648,000 barrels per day for July and August. Producers are struggling to reach their increased quota as insufficient investment in production capacity has hampered their efforts in countries such as Libya and Nigeria.
Iranian supplied oil is back on the radar with the potential revival of the 2015 Iranian nuclear deal, which could lead to the country's oil flowing onto global markets. Talks between Iran and the United States are expected to take place in Qatar in July.
G-7 leaders and officials are exploring a potential price cap on Russian oil as part of sanctions being imposed due to Russia’s ongoing conflict with Ukraine. The proposed mechanism would work by imposing restrictions on insurance and shipping where insurers would be allowed to cover shipments of Russian oil only if the sales price falls under a cap.
DAILY TREND: SIDEWAYS
Source: ICE Connect
Brent broke $110 and traded back towards $120 almost reaching $122 early June before falling towards $104 over the first three weeks of the month.
Brent remained in an overall up trend bias given the maintenance of higher lows, and which may not be challenged until prices break prices past the $100 level.
OPEC+ agreed to increase the monthly production target by 648,000 barrels per day for July and August during their 30th June meeting. This was welcomed by the market and saw price drop on the news, but this could change future decisions by OPEC+ to continue increasing production if the economic outlook continues to weaken and impact demand.
Brent closed the month at $109.03 with a -3.6% change.
UPCOMING HIGH IMPACT EVENTS
Thr 30 Jun OPEC+ policy meeting to decide on whether to increase supply of oil in August by 648,000 barrels per day towards a total of 10 million barrels per day.
Key Figures -
Source: ICE Connect, ~30 Days
Please feel free to join our ˲tradewithufos community, we provide comprehensive trading courses and trading apps. Apps for market analysis and trading: www.tradewithufos.com/apps
Disclaimer: All Content contained on the Platforms are provided for informational purposes only. You further acknowledge that nothing contained on the Platforms or made available through the Platforms constitutes investment, legal, tax or other advice, nor is it to be relied upon in making any investment or other decisions. You should seek professional advice prior to making any investment decisions.
Risk Disclosure: Futures and forex trading contains substantial risk and is not for every investor. An investor could potentially lose all or more than the initial investment. Risk capital is money that can be lost without jeopardizing ones’ financial security or life style. Only risk capital should be used for trading and only those with sufficient risk capital should consider trading. Past performance is not necessarily indicative of future results.
Hypothetical Performance Disclosure: Hypothetical performance results have many inherent limitations, some of which are described below. No representation is being made that any account will or is likely to achieve profits or losses similar to those shown; in fact, there are frequently sharp differences between hypothetical performance results and the actual results subsequently achieved by any particular trading program. One of the limitations of hypothetical performance results is that they are generally prepared with the benefit of hindsight. In addition, hypothetical trading does not involve financial risk, and no hypothetical trading record can completely account for the impact of financial risk of actual trading. for example, the ability to withstand losses or to adhere to a particular trading program in spite of trading losses are material points which can also adversely affect actual trading results. There are numerous other factors related to the markets in general or to the implementation of any specific trading program which cannot be fully accounted for in the preparation of hypothetical performance results and all which can adversely affect trading results.
Virtual Currency Disclosure: View CFTC advisories as they contain more information on the risks associated with trading virtual currencies.
Testimonial Disclosure: Testimonials appearing on this website may not be representative of other clients or customers and is not a guarantee of future performance or success.
This website uses cookies so that we can provide you with the best user experience possible. Cookie information is stored in your browser and performs functions such as recognizing you when you return to our website. Enabling the cookies imply you agree with our privacy policy and terms of use.
Strictly Necessary Cookies
Strictly Necessary Cookie should be enabled at all times so that we can save your preferences for cookie settings.
If you disable this cookie, we will not be able to save your preferences. This means that every time you visit this website you will need to enable or disable cookies again.